In today’s data-driven world, the demand for skilled data analysts has skyrocketed, as organizations rely on data to make informed decisions and stay competitive. Elysium Academy Data Analyst Course is designed to meet this growing demand, equipping aspiring analysts with the skills, tools, and resources essential for a successful career in data analysis. Whether you are transitioning from a different field, advancing your current knowledge, or stepping into the job market, this comprehensive checklist will guide you through the skills, tools, and resources necessary for mastering data analysis.
The Importance of a Data Analyst Course
Pursuing a Data Analyst Course is an investment in your future, especially as businesses increasingly depend on data to make strategic decisions. As the bridge between data and decision-making, data analysts need a strong foundation in statistics, data management, and visualization, along with the ability to work with specialized tools and programming languages. Elysium Academy data analyst course is crafted to meet these demands, offering structured, practical, and industry-relevant training.
By taking a Data Analyst Course, you not only learn the technical skills but also understand how to interpret and communicate data-driven insights. A well-designed course like Elysium Academy covers everything from foundational topics to advanced tools, ensuring that you’re equipped to handle real-world challenges upon entering the job market.
Essential Skills for Data Analysts
To succeed as a data analyst, there are several core skills you need to develop. These foundational skills allow you to work efficiently with data, understand its implications, and present meaningful insights. Let’s explore the top skills every aspiring data analyst should master.

Statistical Knowledge
Statistics is the backbone of data analysis. With a strong statistical foundation, you can interpret data, make predictions, and support business decisions with quantitative evidence. Elysium Academy Data Analyst Course covers key statistical areas such as:
- Descriptive Statistics: This includes calculating measures of central tendency (mean, median, mode) and measures of spread (variance, standard deviation). These are used to summarize data and identify patterns.
- Inferential Statistics: Going beyond describing data, inferential statistics allow analysts to make predictions and test hypotheses. Understanding probability distributions, sampling, and hypothesis testing is crucial.
- Regression Analysis: Regression techniques help in identifying relationships between variables. For example, it can predict how sales might increase with higher marketing spend or forecast trends.
- Probability Theory: This is used to assess risks and model uncertainties. A solid grasp of probability helps in making informed guesses and evaluating the likelihood of various outcomes.
Data Cleaning and Preparation
Before any analysis can begin, data needs to be clean and well-organized. Data cleaning and preparation consume a significant portion of an analyst’s time, as raw data often contains inconsistencies, missing values, or irrelevant information. Key processes in data preparation include:
- Data Cleaning: This involves identifying and correcting errors or inconsistencies within data, such as duplicate entries, incorrect formats, and anomalies.
- Handling Missing Values: Missing data is a common issue. Strategies include filling missing values with averages, medians, or estimates or removing incomplete rows or columns.
- Outlier Detection: Outliers can skew results. Identifying and deciding how to handle them (e.g., removal or transformation) is crucial for accurate analysis.
- Data Transformation: This includes standardizing and normalizing data to ensure it’s in the right format and comparable across datasets. For instance, converting currency, time zones, or measurement units might be necessary.
Data Visualization Skills
Data visualization is essential for translating complex data into understandable insights. As a data analyst course, you’ll often need to present your findings to stakeholders who may not have a technical background. Visualization skills help make data accessible, insightful, and actionable.
- Basic Charting: The ability to create bar charts, line charts, and pie charts is fundamental for summarizing key metrics.
- Advanced Visualization Techniques: These include heatmaps, histograms, and scatter plots, which provide deeper insights into trends, relationships, and distributions.
- Storytelling with Data: Effective data analysts know how to structure a narrative around their findings, combining visuals with contextual explanations that drive home key points.
- Dashboards and Reports: Tools like Tableau and Power BI allow you to create interactive dashboards that can be updated in real-time, offering stakeholders a dynamic way to view data insights.
Must-Know Tools for Data Analysts
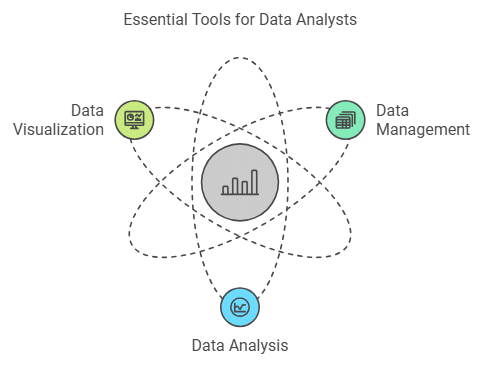
Technical skills are only as effective as the tools that bring them to life. Today, data analysts have access to an array of tools designed for managing, analyzing, and visualizing data. The Elysium Academy Data Analyst Course ensures students become proficient with these essential tools.
Excel and Spreadsheets
Excel remains one of the most versatile and widely-used tools for data analysis. Its advanced functions allow for efficient data organization, transformation, and basic analysis, making it a go-to tool for many analysts. Key Excel functions to master include:
- Pivot Tables: Pivot tables are invaluable for summarizing and rearranging data. They allow you to analyze large datasets quickly and efficiently.
- Data Sorting and Filtering: Excel provides robust options to sort data by specific criteria, making it easier to isolate relevant information.
- Formulas and Functions: From basic math functions to more complex statistical operations, Excel’s built-in functions are essential for calculations, data lookup, and analysis.
- Macros: Automating repetitive tasks with macros can save significant time and reduce human error, making Excel even more powerful.
SQL
Structured Query Language (SQL) is a must for data analysts, as it allows them to interact with large databases, retrieve specific data, and perform complex queries.
- Basic Queries: With SELECT, FROM, and WHERE statements, SQL enables you to pull specific records based on various criteria.
- Joins: SQL joins allow analysts to combine data from multiple tables, which is essential for comprehensive analysis.
- Aggregations: Aggregate functions such as SUM, COUNT, and AVG help in summarizing data to produce meaningful insights.
- Data Manipulation: SQL’s INSERT, UPDATE, and DELETE commands allow analysts to modify data within a database, making it a flexible tool for ongoing data management.
Python and R Programming
For more advanced analysis, Data Analyst Course often rely on programming languages like Python and R. Both offer powerful libraries specifically designed for data analysis.
- Python: Python’s libraries, such as Pandas and NumPy, simplify data manipulation, while Matplotlib and Seaborn enable visualization. Python is versatile and easy to learn, making it popular among beginners and experts alike.
- R: Known for its statistical prowess, R is widely used in academic and research settings. Its ggplot2 library produces highly customizable visualizations, while dplyr allows for efficient data manipulation.
- Data Wrangling and Cleaning: Libraries like Pandas in Python allow data analysts to filter, transform, and clean data quickly.
- Machine Learning and Predictive Analysis: With Python’s Scikit-learn, data analysts can start experimenting with predictive analytics, exploring algorithms like regression, clustering, and decision trees.
Resources to Enhance Learning
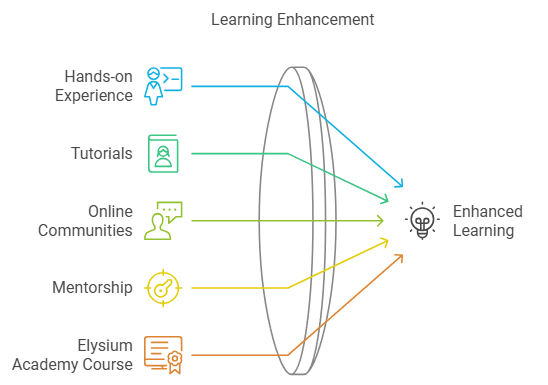
In addition to hands-on experience, learning resources like tutorials, online communities, and mentorship can make a significant difference in your progress. Elysium Academy Data Analyst Course provides access to a range of resources designed to deepen understanding and encourage continuous growth.

- Video Tutorials: These provide visual and auditory explanations of concepts, making complex topics more digestible.
- Interactive Labs and Projects: Real-world data projects help you apply what you learn, giving you confidence to tackle on-the-job challenges.
- Case Studies: Studying successful data projects provides insights into best practices, common pitfalls, and the impact data analysis can have on business outcomes.
- Mentorship and Community Support: Connecting with experienced analysts and other students offers guidance, answers to questions, and feedback on your work. A collaborative learning environment also encourages sharing knowledge and networking.
FAQs on Data Analyst Courses
1. How long does it take to complete a data analyst course?
Most courses span 3 to 6 months, though the timeline can vary depending on the course format and learning pace.
2. Are prerequisites needed for a data analyst course?
Generally, a basic understanding of mathematics and computer usage is sufficient. Many courses start with introductory modules for those with no prior experience.
3. Is Python or R better for data analysis?
Both have their strengths; Python is versatile and great for general data tasks, while R is excellent for statistical analysis. Elysium Academy covers both languages to ensure you are well-rounded.
4. Will I get a certification?
Yes, upon successful completion of Elysium Academy course, you will receive a certification that can enhance your resume.
5. Can I work as a freelance data analyst after completing the course?
Yes, many data analysts work on a freelance basis. Having a recognized certification can boost your credibility.
Why Elysium Academy Data Analyst Course is the Right Choice
Choosing Elysium Academy means opting for a learning experience tailored to real-world needs. Here, the emphasis is on practical application, ensuring that students not only understand data but also learn how to apply it in business contexts. This approach allows students to confidently enter the workforce, armed with practical skills and insights that can make an immediate impact. Elysium Academy team of experienced instructors and mentors are committed to helping students succeed, providing ongoing support and feedback through interactive labs, personalized mentorship sessions, and peer-reviewed projects. By working with mentors who bring industry expertise, students gain insights that go beyond textbooks, preparing them for the nuances of data analysis in various fields.
Conclusion: Taking the First Steps Toward a Data Analyst Career
Embarking on a data analyst career is a significant and rewarding step, but it requires the right skills, tools, and guidance. Elysium Academy Data Analyst Course offers a structured, in-depth pathway to equip aspiring analysts with everything they need to excel in this dynamic field. By enrolling in a comprehensive, industry-aligned program, you gain not only theoretical knowledge but also hands-on experience with real-world data scenarios, preparing you to tackle complex analytical challenges from day one.
A career in data analysis demands proficiency in a wide array of skills, from statistical analysis and data wrangling to visualization and storytelling. It’s about transforming raw numbers and data points into actionable insights that drive critical business decisions. Elysium Academy Data Analyst Course is designed to break down these skills into manageable, well-organized modules, covering foundational topics like statistics and data cleaning, while progressing toward more advanced areas like machine learning and predictive modeling. This approach ensures you build a solid base and continuously deepen your expertise as you advance through the curriculum.


